dr.ricky online

Category: Science

Issues on science.

  • Observations on Primary Elections

    Observations on Primary Elections

    Today was one of the election days in Texas. As a primer for the reader who is unfamiliar with the political set up in America, the scene is dominated by two main political parties: the Republican and the Democratic parties. And before the main elections, each party holds primary elections to install the main candidate that they are putting into the main election for each office. Although the field may have, for example, 14 potential candidates vying for the District 2 Congressional seat (9 for the Republicans, and 5 from the Democrats), by the end of the primary elections, there will be two candidates. This type of hypersimplification extends to much of American politics, even when describing issues that aren’t candidates running for office, such as resolutions or statements of principle.

    Any one voter is allowed to vote in only one of the primary races, but this only serves to narrow the field within that party. The vote to win the actual office doesn’t happen until November, and is completely separate from the primary voting. I have a friend who votes in the primary in the party he will ultimately not be supporting – and this makes sense. If one is aligned ultimately with the values of a particular party, choosing to influence the composition of the opposing party means a long term engineering of overall political values towards the compromised middle, regardless of party name.

    Texas primary election ballots both begin with statements declaring party identity

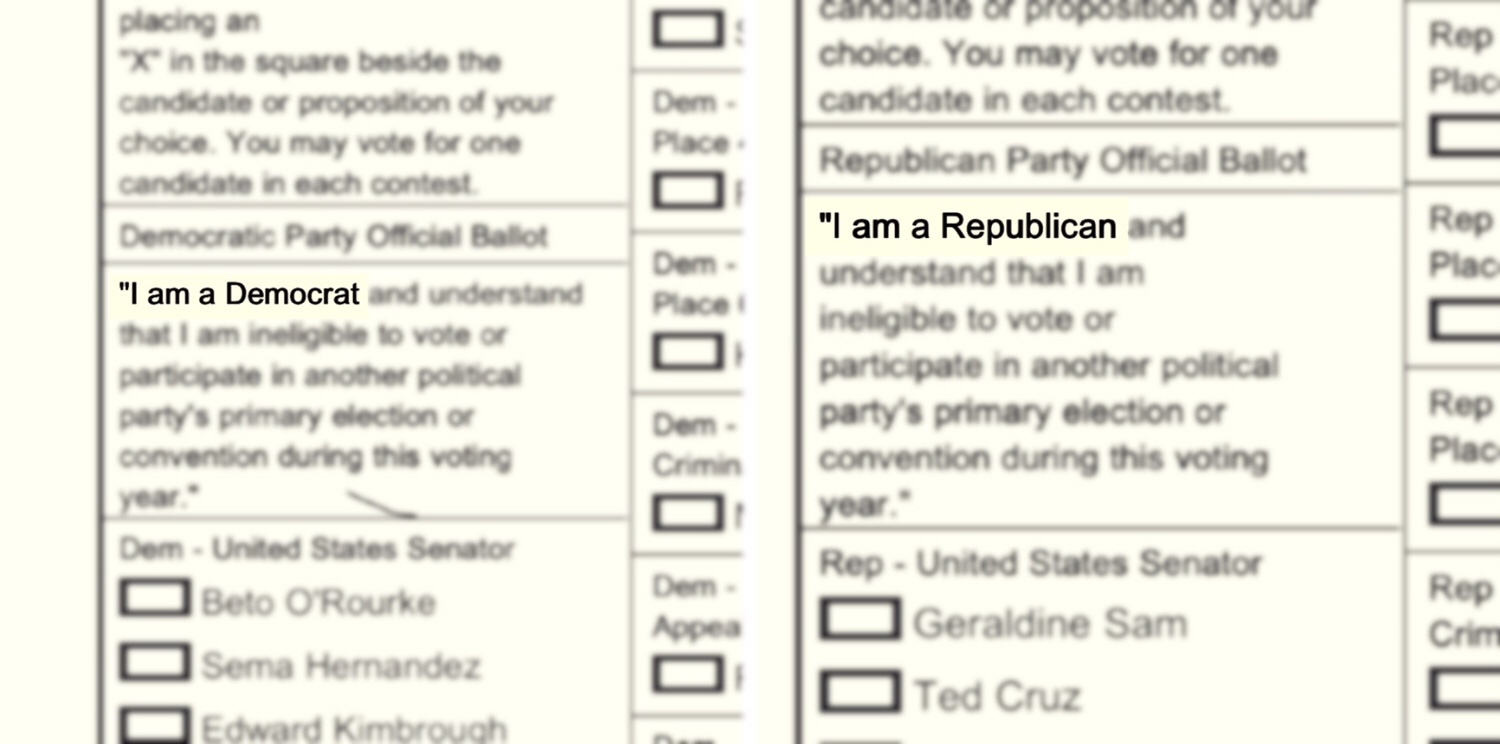
    But the system is rigged early on to foster tribalist mindsets. Instead of separating party values as an issue to be discussed, voters are asked to identify themselves as Republicans or Democrats first. This subtle language establishes tribes right away, setting up the “us vs them” attitude long before any other issues are described, and thus maintains partisanship first. This nudge is how people can be led to voting against their own best interests, as fear of tribal rejection often overrides even statements of fact. David McRaney did a particularly good podcast episode on Tribal Psychology that is worth checking out. Learning to recognize the signs of tribal separation is an important skill – humans evolved to rapidly segregate into tribes, and this urge colors almost all aspects of judgement.

  • How extinction shaped the Australian outback

    How extinction shaped the Australian outback

    The story in the Atlantic.

    When extinction is spoken about, it’s almost exclusively in terms of land based vertebrates, usually mammals, which form a tiny portion of the biodiversity of the planet. And even that attention is heavily skewed towards “charismatic megafauna” – animals that are cute and big enough to be visible. But it’s the extinction of the small and spineless that can shape how the world works. The very oxygen rich atmosphere of the planet is possible in part due to the extinction of anaerobic microbes, and how the extinction of oysters in the Hudson River changed the lives of New Yorkers.

  • BCAAs

    BCAAs

    Most people obsessed with BCAAs don’t even know what an amino acid is.

    FYI: BCAA = branched chain amino acid

  • Vaccination Exemptions in the USA

    Vaccination Exemptions in the USA

    Vaccination Exemptions in the USA

    The United States Centers for Disease Control (CDC) publishes a Morbidity and Mortality Weekly Report, and in it they track the vaccination rates in different states for children enrolled in kindergarten, and an interesting table is the report on the rate of exemptions from vaccinations, as well as the reason behind it. Granted, different states have varying laws with regards to vaccination requirements, and some allow separation of the exception reasons between medical, religious and other philosophical reasons, which makes getting consistent data problematic. But we do have good data for the 2015–2016 enrollment, and the 2016–2017 enrollment.

    The reports themselves are straight tables, but data visualization helps in teasing out the meaning there.

    2016_2017_CDC
    Summarizing the CDC reports between 2015-2016 and 2016-2017 school years for the rate of vaccine exemptions among kindergarten students, divided by state. A number of states are excluded. Blue dots are for the earlier year, red dots for the data a year later. Note that for herd immunity, the general consensus is about 95% of the population should be vaccinated. The Y-axis displays the ratio between medical and non medical reasons given for the exemption. Note that with the exception of DC, all states have ratios below 1, which means that more people are seeking exemptions for religious or philosophical reasons than for medical ones. 

    This data is dense, but highlights some problematic states, like Oregon, which has an unusually high rate of vaccine exemptions, and most of them for non medical reasons. Let’s look at the trend from year to year.

    Change year
    The arrows point in the direction which portend better public health trends: a drop in the rate of exemptions, and an increase in ratio of medical to non-medical reasons. California and Vermont seem to be on the right track, but most of the country is actually inching in the wrong direction, with Nevada and Wisconsin leading the way. 

    Sadly, the antivaccinationist movement seems to be permeating the mindshare, just by manipulating doubt and exploiting parental concern. Non medical exemptions are a key to this degradation of our public health system.

  • The mythical 300 jumps

    The mythical 300 jumps

    This article has moved to a new location.

    Wilson, the sporting goods company, posted an ad on Instagram declaring

    DURING A MATCH, VOLLEYBALL PLAYERS ON AVERAGE JUMP 300 TIMES.

    The ad is accompanied by an illustration that depicts female beach volleyball players, which implies that this number applies to beach volleyball specifically. This number appears unusually high, so I inquired as to the source of the number.

    https://instagram.com/p/BedVH6rAMp0/

    Michelle Magsamen checked with the marketing department of Wilson, and provided three links that are the alleged source of this figure:

    1. From Redbull.com8 stats that show why beach volleyball is the best

    A beach ’baller jumps on average 300 times per game.

    In this article, the author Jonno Turner reports an average of 300 jumps per game – not per match as reported by the advertisement.

    1. From Schoolgamesfinals.org – this is an article written to encourage people to watch indoor volleyball at the school games of Loughborough University. The stat is reported at 300 times per match, but with indoor volleyball, there are up to five games per match, unlike the three set maximum for beach volleyball.
    2. A contributing article in Volleywood.net – written as “10 fun facts about volleyball”, it is a direct reprint from an article Ten fun facts about Volleyball from the website 10-facts-about.com. Fact 4 is listed as:

    Most volleyball players jump about 300 times a match.

    In all likelihood, this last link is the main source of this number, and was continually misinterpreted by the other writers to fit their current narratives. I tracked 10-facts-about.com to a company in Sweden called NanOak Technologies, appears to be a “content farm” – they produce these sites and brands like 10-facts-about and Wisefacts – ostensibly pouring out random interesting “facts” to attract page views, and therefore sell advertising. There is no verifiable vetting of this information, but they are cherrypicked to most likely to appeal to confirmation bias.

    In effect, this is fake news – unvetted information that is twisted just to profit from the misinformation. Though Wilson may have citations, those sources are ultimately unreliable at best.

    So what is the real number?

    Is there real data on the number of times beach volleyball athletes jump on average in a match? Much more peer reviewed data studies the indoor game, but there are some data on beach volleyball.

    1. Loren Anderson of Rise Volleyball Academy did some research on this during a discussion on the Facebook group Beach Volleyball Coaches. He tracked the all the jumps during the gold medal match at the FIVB 4-star beach tournament in the Hague between USA and Brazil. He counted 201 total jumps for all players, averaging 50 jumps per player over the match (~25 jumps per set).
    2. Loren also found a 2009 report from Slovenia (Turpin et al, 2009) that tracked the number and types of jumps during four matches of elite beach volleyball players during a tournament in 2006. They report a total average of 167.5 jumps per match (with a very large variance of 38.5), which comes down to about 40 jumps per player per match, or 20 per set.
    3. Perhaps most useful is that the FIVB report The Picture of the Game, last produced to statistically analyze 12 men’s and 12 women’s matches, and provides some pretty detailed stats and heat maps of defense. On page 37, it reports an average of 405.8 jumps per match (162.3 per set) for women, and 396.8 jumps per match (158.7 per set) for men. Dividing between the four athletes on the court, that comes down to ~40 jumps per set – which is consistent with the Turpin et al report.

    Granted, these are for elite volleyball players playing in high stakes tournaments, but it’s still nowhere near the 300 jumps per match average per player. In fact, only if you account for the jumping of all players on both teams in beach volleyball can you come close to this average number.

    Based on this research, the average number of jumps per player per match in beach volleyball seems to be between 40–80.

    Follow on Twitter and Instagram as @volleysensei