dr.ricky online

Tag: skepticism

  • Visualizing NCAA GPA data

    On 5 Sept 2018, the NCAA Research team tweeted out this chart  :

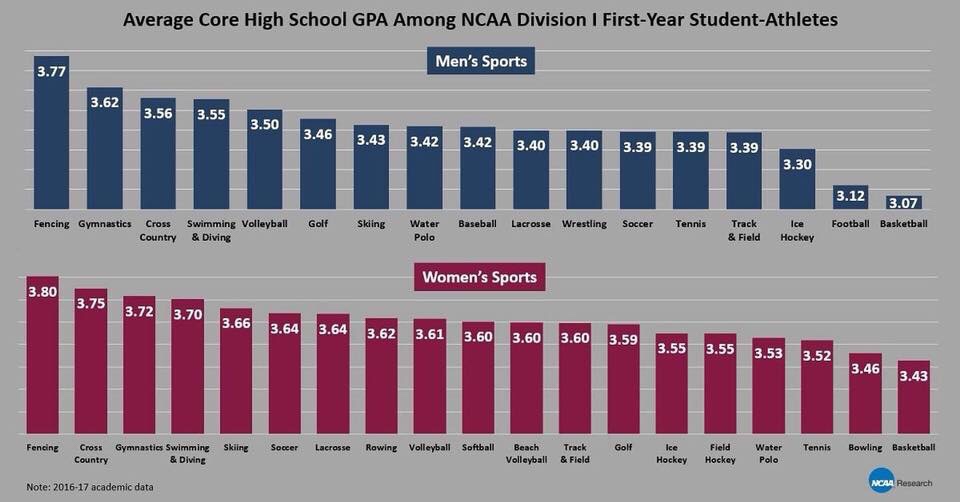
    It reports the average core high school grade point averages (GPA) among NCAA Division I freshman student athletes. So, a bit of a background – the National Collegiate Athletics Association governs just about all collegiate athletic programs in America, and the Division I schools devote the most money and resources to their athletic programs. A great deal of attention is thus focused on the Division I programs, almost to the detriment of the others (it goes all the way to Division III). The GPA is usually used as a measure of academic performance, though it may not reflect the difficulty of the coursework. But this chart is an egregious use of “infographics” to mislead rather than to bring insight to data:

    • Without a Y-axis to denote scale, the use of bar charts here visually make it appear that 3.77 is 7x higher than 3.07, when it’s actually far smaller in scale on standard 4.0 GPA scales (it tops out at 4).
    • The categorical use of the different sports makes it appear that it is the independent variable, and that GPA is what is being measured. But since the GPA was measured in high school, it actually precedes the sport.
    • Because of this switch in dependent and independent variables, a reader may interpret some form of causality – implying for example that choosing fencing will lead to better academic performance.

    Good data visualization should serve to bring new insight to the data that isn’t evident from just looking at the numbers. The GPAs considered here range between 3-4, which is letter grade B-A, quite above average academically, and that is unsurprising. These are the high school GPAs of student athletes recruited to Division I schools, arguably the most competitive programs. This is a measure of their past academic performance, but doesn’t say anything about how the sport chosen affects their current or future performance. The data, however, informs something about the sports programs themselves. Using the exact same data, I replotted the chart.

    High school GPA of males and females as recruited into NCAA Div 1 sports programs.

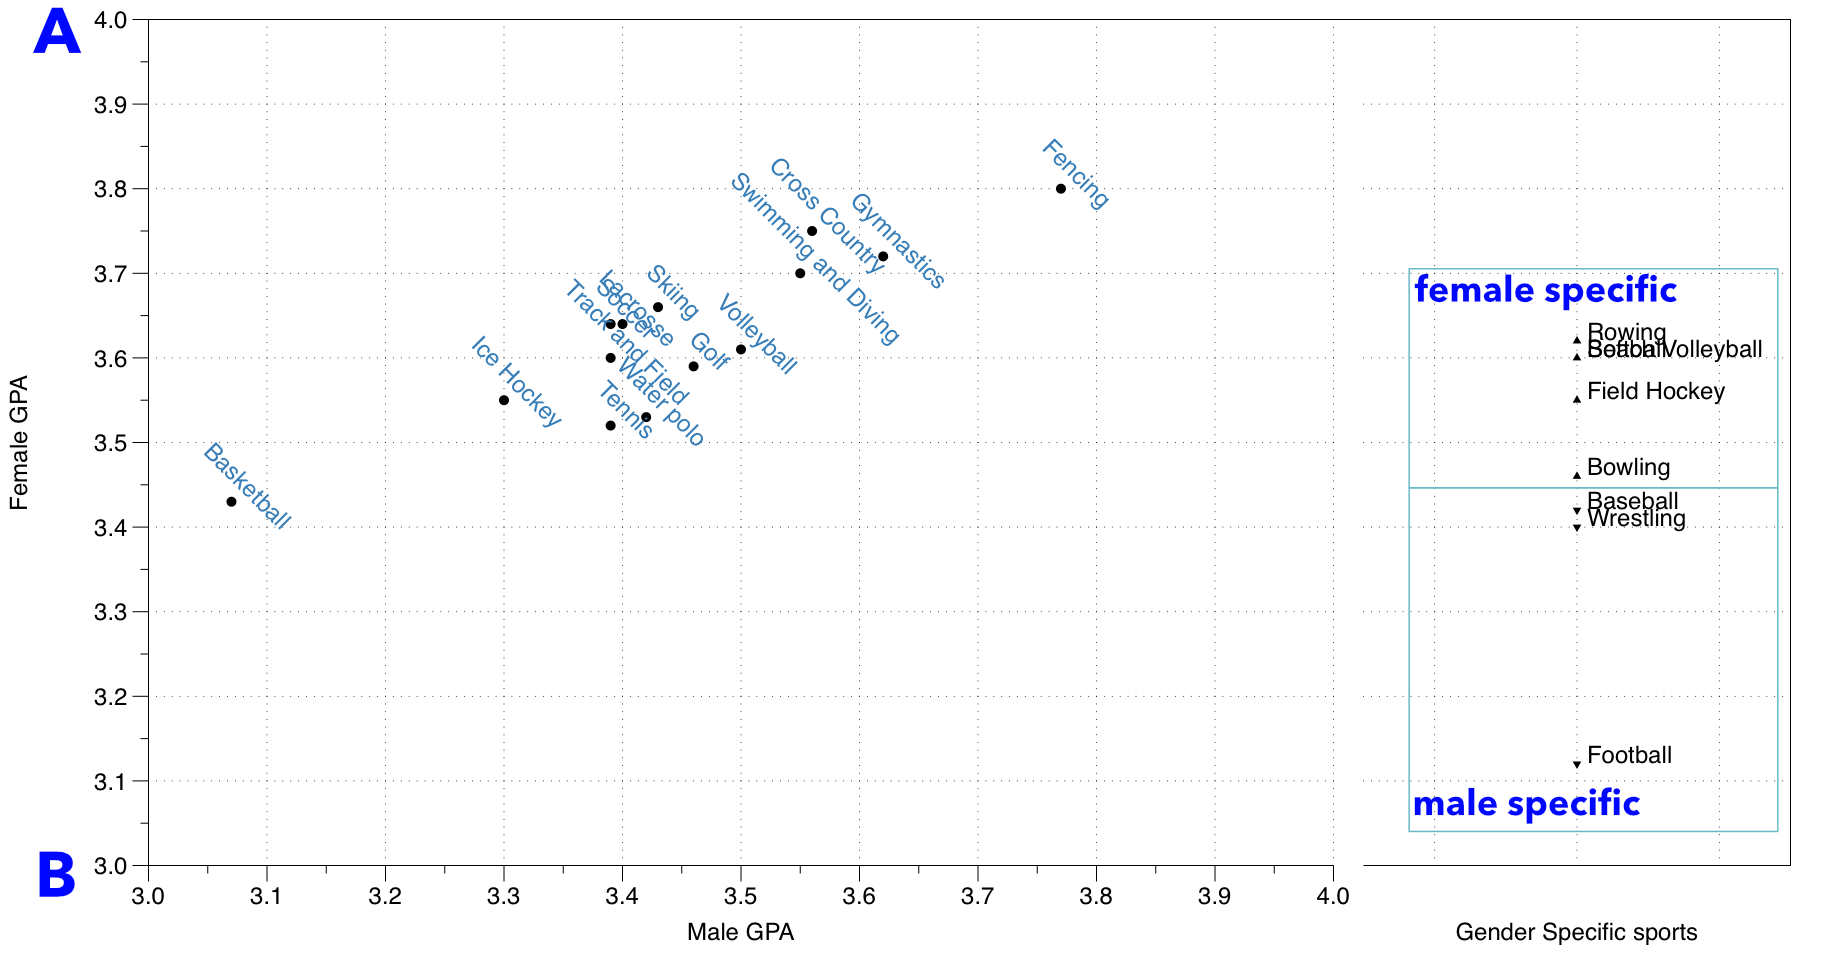
    The chart is in two parts – on the left is the section where a sport is available for both males and females, and on the right is a smaller section for sports that are gender specific. The axes go from 3.0 to 4.0, indicating the spread within this range. Sports are labeled accordingly.

    A linear relationship exists between enrolled female and male student athlete high school GPAs  – regardless of sport program. What this means is that at least within each sport, they apply their GPA criteria roughly with the same proportion to both genders. Which probably means that the sports programs recruit from the same communities for both men and women, that is fencing programs put a heavier emphasis on high GPAs for admission than basketball programs do, regardless of gender. But we see a stark difference in the GPA cutoffs between genders: almost all athletic programs recruit females with a GPA above 3.5, while more than half athletic programs enrolled male student athletes with GPAs below 3.5. In fact, all the male specific sport programs – baseball, wrestling and football – recruit with GPAs below 3.5. One cannot make definitive interpretations without further details on how the data is collected, but this implies that the barrier to entry to a collegiate athletic program, at least based on GPA, is significantly lower for males than for females. While some may think that this indicates superior academic performance among female student athletes, it could be an indicator for a systemic bias when recruiting for women across all sports programs.

  • Falsifiability

    Falsifiability

    In an earlier posting on detecting the signs of pseudoscience, I quoted an article which mentions unfalsifiability as a property. This is actually a pretty good early test for understanding if something is science-based, and attends to a common misunderstanding about the scientific process.

    Whenever the phrase “scientifically proven” is used, your critical thinking alarm bells should go off – because much of scientific progress is based on disproving things. Unambiguously proving a hypothesis is actually quite difficult and rare, but what happens more frequently is disproving the counter-hypothesis, because all you need is a simple break in the logic or a sample contrary to it. When a conjecture or concept withstands extensive attempts at disproof is when it enters the field as a major theory.

    Let’s try this out. Take the statement that “All cars have four wheels”. It’s kind of difficult to figure out how to prove this, but finding a single car that has three or five wheels is sufficient to disprove it. A single example of an object falling at a different acceleration rate would be sufficient to disprove what we know about gravity, or a single core sample of fossils forming at a different order would overturn evolution – but after hundreds of years of attempts, these theories have stood their ground. And good scientists continue to think about ways to show that something accepted as true may be false. Which is an important feature – falsifiability is key. And the failure of these tests add to our confidence in these major theories. If you cannot devise a test that will sufficiently disprove the statement, it’s likely outside of science, no matter what the trappings.

    Let’s look at an example of something which is unfalsifiable. This is taken directly from the product description page of VitaminShoppe, a prominent sponsor for the AVP (US domestic pro beach volleyball tour):

    Naturally detoxifies and boosts your immune system

    Can you think of a test that will falsify this statement? What kind of trial could be done to definitively show that something does not “boost the immune system” or “naturally detoxify”? Near as I can tell, this falls into the category of unfalsifiable, sort of like the claim that a machine detects ghosts. When evaluating promises made through coaching advice, improve your critical thinking skills by asking how you can falsify a statement. And this is how we progressively increase confidence in practice.

  • The mythical 300 jumps

    The mythical 300 jumps

    This article has moved to a new location.

    Wilson, the sporting goods company, posted an ad on Instagram declaring

    DURING A MATCH, VOLLEYBALL PLAYERS ON AVERAGE JUMP 300 TIMES.

    The ad is accompanied by an illustration that depicts female beach volleyball players, which implies that this number applies to beach volleyball specifically. This number appears unusually high, so I inquired as to the source of the number.

    https://instagram.com/p/BedVH6rAMp0/

    Michelle Magsamen checked with the marketing department of Wilson, and provided three links that are the alleged source of this figure:

    1. From Redbull.com8 stats that show why beach volleyball is the best

    A beach ’baller jumps on average 300 times per game.

    In this article, the author Jonno Turner reports an average of 300 jumps per game – not per match as reported by the advertisement.

    1. From Schoolgamesfinals.org – this is an article written to encourage people to watch indoor volleyball at the school games of Loughborough University. The stat is reported at 300 times per match, but with indoor volleyball, there are up to five games per match, unlike the three set maximum for beach volleyball.
    2. A contributing article in Volleywood.net – written as “10 fun facts about volleyball”, it is a direct reprint from an article Ten fun facts about Volleyball from the website 10-facts-about.com. Fact 4 is listed as:

    Most volleyball players jump about 300 times a match.

    In all likelihood, this last link is the main source of this number, and was continually misinterpreted by the other writers to fit their current narratives. I tracked 10-facts-about.com to a company in Sweden called NanOak Technologies, appears to be a “content farm” – they produce these sites and brands like 10-facts-about and Wisefacts – ostensibly pouring out random interesting “facts” to attract page views, and therefore sell advertising. There is no verifiable vetting of this information, but they are cherrypicked to most likely to appeal to confirmation bias.

    In effect, this is fake news – unvetted information that is twisted just to profit from the misinformation. Though Wilson may have citations, those sources are ultimately unreliable at best.

    So what is the real number?

    Is there real data on the number of times beach volleyball athletes jump on average in a match? Much more peer reviewed data studies the indoor game, but there are some data on beach volleyball.

    1. Loren Anderson of Rise Volleyball Academy did some research on this during a discussion on the Facebook group Beach Volleyball Coaches. He tracked the all the jumps during the gold medal match at the FIVB 4-star beach tournament in the Hague between USA and Brazil. He counted 201 total jumps for all players, averaging 50 jumps per player over the match (~25 jumps per set).
    2. Loren also found a 2009 report from Slovenia (Turpin et al, 2009) that tracked the number and types of jumps during four matches of elite beach volleyball players during a tournament in 2006. They report a total average of 167.5 jumps per match (with a very large variance of 38.5), which comes down to about 40 jumps per player per match, or 20 per set.
    3. Perhaps most useful is that the FIVB report The Picture of the Game, last produced to statistically analyze 12 men’s and 12 women’s matches, and provides some pretty detailed stats and heat maps of defense. On page 37, it reports an average of 405.8 jumps per match (162.3 per set) for women, and 396.8 jumps per match (158.7 per set) for men. Dividing between the four athletes on the court, that comes down to ~40 jumps per set – which is consistent with the Turpin et al report.

    Granted, these are for elite volleyball players playing in high stakes tournaments, but it’s still nowhere near the 300 jumps per match average per player. In fact, only if you account for the jumping of all players on both teams in beach volleyball can you come close to this average number.

    Based on this research, the average number of jumps per player per match in beach volleyball seems to be between 40–80.

    Follow on Twitter and Instagram as @volleysensei