dr.ricky online

Tag: critical thinking

  • The blue finger of democracy

    Blue finger of democracy

    In 2005, when elections were restored to Iraq, voters marked their participation by dipping their index finger in blue ink. Texas forbade the use of mail-in ballots for elections beyond a certain set of strictures, so most are forced to vote in person at a time when COVID–19 cases are increasing at an alarming rate in the state. Poll workers heroically dressed in PPE to allow citizens to practice their fundamental right to vote. Physical contact is limited, and each voter is provided a finger condom, and an alcohol wipe to sterilize surfaces. At the very least, one only needs one finger to interact with the voting machine (I’ll note that the machine isn’t easy to reach from a wheelchair).

    Election Day is July 14, 2020 but to avoid the potential crowds spreading the virus, early voting is advisable. Early voting should be accessible from just about any of the precincts. Go vote.

  • Visualizing NCAA GPA data

    On 5 Sept 2018, the NCAA Research team tweeted out this chart  :

    It reports the average core high school grade point averages (GPA) among NCAA Division I freshman student athletes. So, a bit of a background – the National Collegiate Athletics Association governs just about all collegiate athletic programs in America, and the Division I schools devote the most money and resources to their athletic programs. A great deal of attention is thus focused on the Division I programs, almost to the detriment of the others (it goes all the way to Division III). The GPA is usually used as a measure of academic performance, though it may not reflect the difficulty of the coursework. But this chart is an egregious use of “infographics” to mislead rather than to bring insight to data:

    • Without a Y-axis to denote scale, the use of bar charts here visually make it appear that 3.77 is 7x higher than 3.07, when it’s actually far smaller in scale on standard 4.0 GPA scales (it tops out at 4).
    • The categorical use of the different sports makes it appear that it is the independent variable, and that GPA is what is being measured. But since the GPA was measured in high school, it actually precedes the sport.
    • Because of this switch in dependent and independent variables, a reader may interpret some form of causality – implying for example that choosing fencing will lead to better academic performance.

    Good data visualization should serve to bring new insight to the data that isn’t evident from just looking at the numbers. The GPAs considered here range between 3-4, which is letter grade B-A, quite above average academically, and that is unsurprising. These are the high school GPAs of student athletes recruited to Division I schools, arguably the most competitive programs. This is a measure of their past academic performance, but doesn’t say anything about how the sport chosen affects their current or future performance. The data, however, informs something about the sports programs themselves. Using the exact same data, I replotted the chart.

    High school GPA of males and females as recruited into NCAA Div 1 sports programs.

    The chart is in two parts – on the left is the section where a sport is available for both males and females, and on the right is a smaller section for sports that are gender specific. The axes go from 3.0 to 4.0, indicating the spread within this range. Sports are labeled accordingly.

    A linear relationship exists between enrolled female and male student athlete high school GPAs  – regardless of sport program. What this means is that at least within each sport, they apply their GPA criteria roughly with the same proportion to both genders. Which probably means that the sports programs recruit from the same communities for both men and women, that is fencing programs put a heavier emphasis on high GPAs for admission than basketball programs do, regardless of gender. But we see a stark difference in the GPA cutoffs between genders: almost all athletic programs recruit females with a GPA above 3.5, while more than half athletic programs enrolled male student athletes with GPAs below 3.5. In fact, all the male specific sport programs – baseball, wrestling and football – recruit with GPAs below 3.5. One cannot make definitive interpretations without further details on how the data is collected, but this implies that the barrier to entry to a collegiate athletic program, at least based on GPA, is significantly lower for males than for females. While some may think that this indicates superior academic performance among female student athletes, it could be an indicator for a systemic bias when recruiting for women across all sports programs.

  • Homographic terms

    Homographic terms

    Many terms in athletic coaching are poorly defined yet form the basis of disagreements. For example, the word athletic is really not quantifiable, and describes some quality that cannot be calibrated, yet is used as a basis of comparing people. In volleyball, the idea of ball control is heavily valued, is generally thought be observable, but different people will have different specific ideas as to what constitutes having ball control, or how to measure it.

    Homographic (despite the potentially juvenile interpretation) refer to situations where the same word can carry multiple meanings, and thus be confused between concepts, often leading to disagreements because each party was actually thinking of a different meaning for that word. For example, the word fly can be used both as a noun and a verb, each one carrying radically different meanings.

    But a more subtle disagreement comes with blocking. Blocking refers to both a technique and a strategy. For stat collection purposes, in beach volleyball, a block is only recorded when a player earns a point by jumping up and  intercepting a ball at the net. Consequently, this technique is confused with the whole strategy of blocking, which is a component of defense that limits the offensive options of the opposing team. Blocking actions that serve to guide the ball out or into the convertible control of the team are just as valuable as a stuff block. The technique of blocking is thus simply one of the options of the strategy of blocking. Good blockers consider all the available tools for the strategy. A jumping blocker that knocks the ball out of the defensive arena simply introduces unnecessary unpredictability. An effective blocker may never jump at all, and still control the attack options of the other team, and the contribute to the point conversion opportunities.

    Google Image result for volleyball setting

    Another term with homographic confusion between a technique and a strategy is setting – the popular image of volleyball setting (at least as unscientifically assayed through Google Images) is the distinct technique hand setting. Operationally, though, setting is a strategy of establishing the offensive opportunities for the team, and, as with blocking, the technique of hand setting is merely one of the many factors that figure into the strategy of good setting. One who can execute the technique of a hand setting well is not necessarily a good strategic setter. Conversely, good strategic setting should have a broad range of control techniques to carry options for efficient point scoring. Unfortunately, much of the dialog conflates the two meanings of setting, leading to this notion that one can judge the strategic value of a setter simply by evaluating the execution of the technique.

  • Recognizing Sports Pseudoscience

    Recognizing Sports Pseudoscience

    In a recent discussion with BJ Leroy of USA Volleyball, I encountered a paper by Bailey et al (2018) published in the open access journal Frontiers in Psychology, titled The Prevalence of Pseudoscientific Ideas and Neuromyths Among Sports Coaches“. Since the journal is open access, the paper is readily available to download and read. The paper is basically a study on the pervasiveness of pseudoscience among sports coaches, even with ideas that have been long established to be untrue. Dr. Ed Couglin wrote a layperson friendly (albeit Irish-centric) interpretation of the paper.

    Suffice it to say, pseudoscience is rampant in sports culture, and pervasive in beach volleyball. I’d say much of the sponsor economy is built around pseudoscientific beliefs, but I’ll address those specific examples in future articles. What I’d like to share here is an excerpt from the Bailey paper, that outlines some properties of pseudoscience which will help you identify it. Bear in mind, this also applies to how people may argue their points online.

    • Unfalsifiability
    • Absence of self-correction
    • Overuse of ad hoc immunizing tactics designed to protect theories from refutation
    • Absence of connectivity with other domains of knowledge
    • Use of unnecessarily unclear language
    • Over-reliance on anecdotes and testimonials at the expense of systematic evidence
    • Evasion of genuine peer review
    • Emphasis on confirmation rather than refutation.
  • The mythical 300 jumps

    The mythical 300 jumps

    This article has moved to a new location.

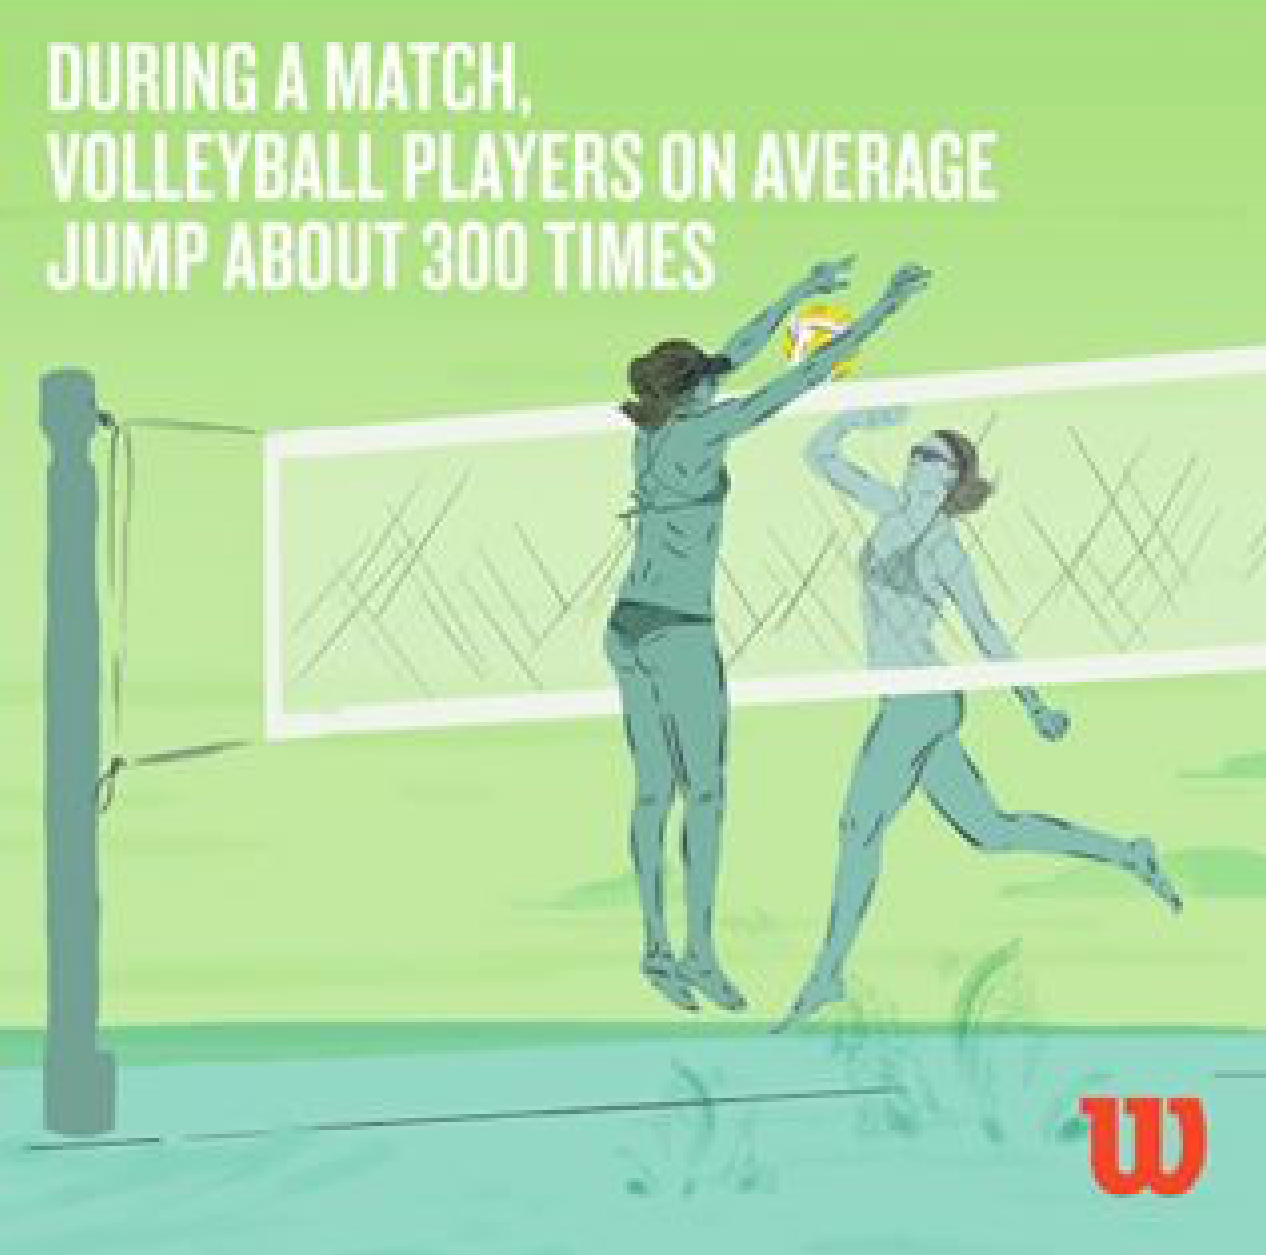
    Wilson, the sporting goods company, posted an ad on Instagram declaring

    DURING A MATCH, VOLLEYBALL PLAYERS ON AVERAGE JUMP 300 TIMES.

    The ad is accompanied by an illustration that depicts female beach volleyball players, which implies that this number applies to beach volleyball specifically. This number appears unusually high, so I inquired as to the source of the number.

    https://instagram.com/p/BedVH6rAMp0/

    Michelle Magsamen checked with the marketing department of Wilson, and provided three links that are the alleged source of this figure:

    1. From Redbull.com8 stats that show why beach volleyball is the best

    A beach ’baller jumps on average 300 times per game.

    In this article, the author Jonno Turner reports an average of 300 jumps per game – not per match as reported by the advertisement.

    1. From Schoolgamesfinals.org – this is an article written to encourage people to watch indoor volleyball at the school games of Loughborough University. The stat is reported at 300 times per match, but with indoor volleyball, there are up to five games per match, unlike the three set maximum for beach volleyball.
    2. A contributing article in Volleywood.net – written as “10 fun facts about volleyball”, it is a direct reprint from an article Ten fun facts about Volleyball from the website 10-facts-about.com. Fact 4 is listed as:

    Most volleyball players jump about 300 times a match.

    In all likelihood, this last link is the main source of this number, and was continually misinterpreted by the other writers to fit their current narratives. I tracked 10-facts-about.com to a company in Sweden called NanOak Technologies, appears to be a “content farm” – they produce these sites and brands like 10-facts-about and Wisefacts – ostensibly pouring out random interesting “facts” to attract page views, and therefore sell advertising. There is no verifiable vetting of this information, but they are cherrypicked to most likely to appeal to confirmation bias.

    In effect, this is fake news – unvetted information that is twisted just to profit from the misinformation. Though Wilson may have citations, those sources are ultimately unreliable at best.

    So what is the real number?

    Is there real data on the number of times beach volleyball athletes jump on average in a match? Much more peer reviewed data studies the indoor game, but there are some data on beach volleyball.

    1. Loren Anderson of Rise Volleyball Academy did some research on this during a discussion on the Facebook group Beach Volleyball Coaches. He tracked the all the jumps during the gold medal match at the FIVB 4-star beach tournament in the Hague between USA and Brazil. He counted 201 total jumps for all players, averaging 50 jumps per player over the match (~25 jumps per set).
    2. Loren also found a 2009 report from Slovenia (Turpin et al, 2009) that tracked the number and types of jumps during four matches of elite beach volleyball players during a tournament in 2006. They report a total average of 167.5 jumps per match (with a very large variance of 38.5), which comes down to about 40 jumps per player per match, or 20 per set.
    3. Perhaps most useful is that the FIVB report The Picture of the Game, last produced to statistically analyze 12 men’s and 12 women’s matches, and provides some pretty detailed stats and heat maps of defense. On page 37, it reports an average of 405.8 jumps per match (162.3 per set) for women, and 396.8 jumps per match (158.7 per set) for men. Dividing between the four athletes on the court, that comes down to ~40 jumps per set – which is consistent with the Turpin et al report.

    Granted, these are for elite volleyball players playing in high stakes tournaments, but it’s still nowhere near the 300 jumps per match average per player. In fact, only if you account for the jumping of all players on both teams in beach volleyball can you come close to this average number.

    Based on this research, the average number of jumps per player per match in beach volleyball seems to be between 40–80.

    Follow on Twitter and Instagram as @volleysensei